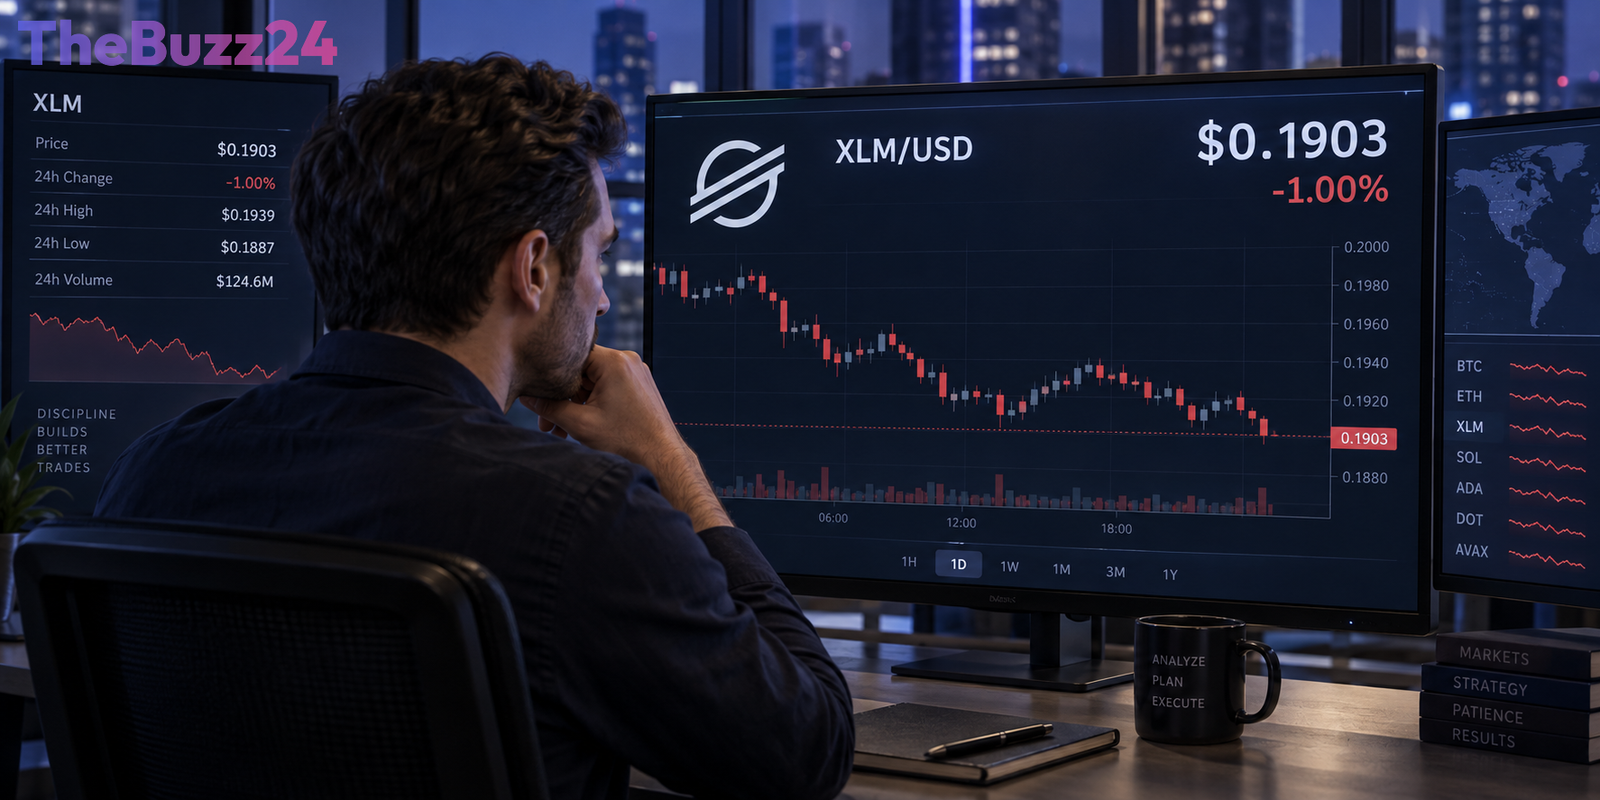
Stellar’s XLM Shows Bullish Signs as Traders Eye Key Support Levels
Stellar’s native cryptocurrency, XLM, is demonstrating resilience by holding firm above critical moving average support zones, signaling a potential for further price appreciation. The digital asset has successfully maintained its position above key technical indicators, preserving its overall bullish market structure.
Recent data from derivatives markets indicates a growing optimism among traders. The long-to-short ratio for XLM has climbed to 1.15, nearing a one-month high. This metric, which compares the number of traders holding long positions versus short positions, suggests an increasing expectation of price increases. Furthermore, positive funding rates, currently at approximately 0.0147%, reinforce this bullish sentiment, as traders betting on price increases are paying those who are shorting the asset.
Technically, XLM is trading around $0.193, having surpassed its 50-day, 100-day, and 200-day exponential moving averages (EMAs). This cluster of EMAs, ranging from $0.179 to $0.188, now acts as a crucial demand zone, potentially attracting buyers during any short-term price dips. The Relative Strength Index (RSI) hovers near 60, indicating a healthy upward momentum without signaling an overbought condition, while the Moving Average Convergence Divergence (MACD) also shows a constructive setup.
Immediate resistance for XLM is observed at the 61.8% Fibonacci retracement level near $0.200. A decisive breach of this level could pave the way for further advances towards the 50% Fibonacci retracement at approximately $0.218 and subsequently the 38.2% level near $0.237. Conversely, should sellers manage to push XLM below the EMA cluster, the support at $0.177 and the 78.6% Fibonacci retracement at $0.173 would become the next critical levels to watch for maintaining the recovery trend.
Key Takeaways
- XLM is trading above key moving average support levels, indicating a potentially bullish trend.
- Derivatives market data, including rising long-to-short ratios and positive funding rates, suggests increased trader confidence in XLM's upward potential.
- Key resistance levels to watch for XLM are around $0.200, with significant support found between $0.173 and $0.188.
Editor’s Analysis & Impact
The current technical and derivatives data for XLM paints a constructive picture, suggesting a potential for continued recovery. The cryptocurrency’s ability to defend major moving averages is a positive sign for bulls, indicating underlying demand. However, the market remains sensitive to broader cryptocurrency trends and regulatory developments. A sustained breakout above the $0.200 resistance level is crucial for confirming further upside potential. Investors should monitor trading volumes and the overall market sentiment, as an excessively bullish positioning could lead to increased liquidation risks if market conditions shift unexpectedly. The coming weeks will be critical in determining if XLM can solidify its gains and challenge higher price targets.
Frequently Asked Questions
Q: What are moving averages in cryptocurrency trading?
A: Moving averages are technical indicators used to smooth out price data by creating a constantly updated average price. They help traders identify trends and potential support or resistance levels by filtering out short-term price fluctuations. Common moving averages include the 50-day, 100-day, and 200-day EMAs (Exponential Moving Averages).
Q: What does a long-to-short ratio of 1.15 mean for XLM?
A: A long-to-short ratio of 1.15 means that for every short position opened, there are 1.15 long positions opened. A ratio above 1 indicates that more traders are betting on the price increasing (long positions) than decreasing (short positions), suggesting a bullish sentiment in the derivatives market for XLM.
Q: What is the significance of the Fibonacci retracement levels for XLM?
A: Fibonacci retracement levels are horizontal lines that indicate potential support and resistance areas based on the Fibonacci sequence. For XLM, levels like 61.8% ($0.200), 50% ($0.218), and 38.2% ($0.237) are identified as potential price targets or barriers that the cryptocurrency may encounter as it moves.
AI Disclosure: This article is based on verified data and official reports. Our Team and AI have cross-referenced every financial detail with primary sources to ensure total accuracy.
More from this Category