Nasdaq Enters Correction Territory Following Midterm Shift: Historical Trends Point to Near-Term Volatility and Eventual Recovery
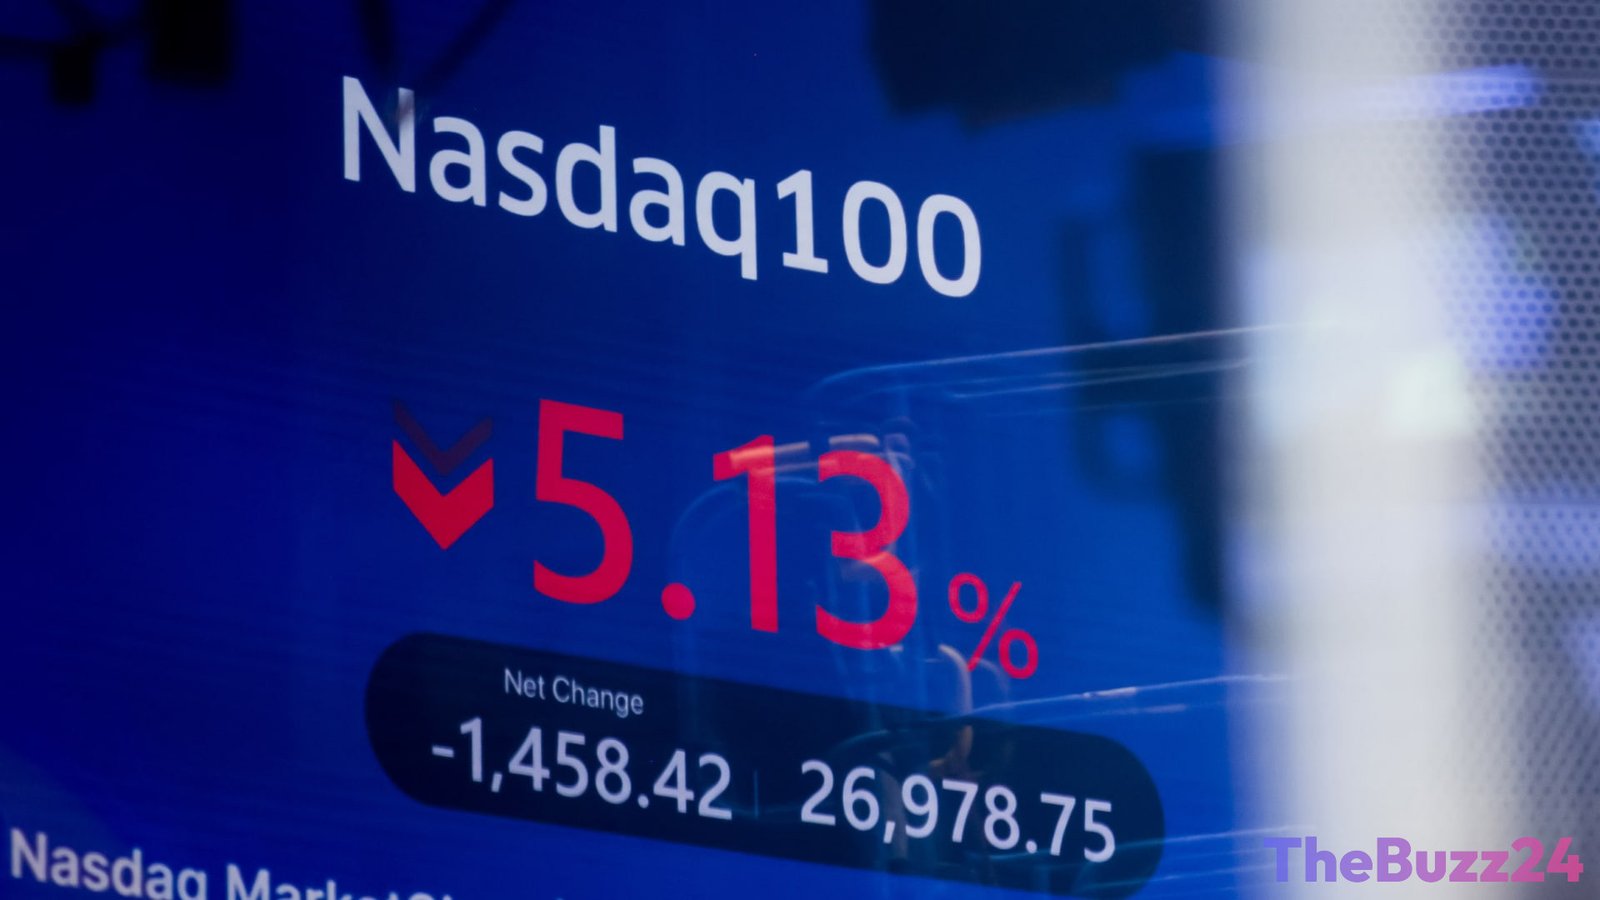
The tech-heavy Nasdaq Composite experienced a sharp downturn on Thursday, sliding more than 5% in a single session and closing over 11% below its peak set last month. This decline officially places the index in correction territory, defined by Wall Street as a drop of 10% or more from recent highs. Semiconductor equities took the brunt of the selloff, with the iShares Semiconductor ETF dropping 12%, marking its steepest one-day loss since early 2020.
Market pressure intensified following the results of Tuesday’s midterm elections, which saw Democrats secure control of both the House and Senate alongside key state-level victories. Among the notable political developments was Gina Hinojosa’s victory in the Texas gubernatorial race after campaigning on an immediate moratorium for data center construction. The political outcome has raised concerns among investors that stricter regulatory environments could hamper facility expansion, placing immediate pressure on enterprise valuations tied to the artificial intelligence boom.
Historical analysis indicates that while short-term turbulence often follows such pullbacks, broader market recoveries typically take shape in the months that follow. Data across 10 previous correction episodes over the past decade reveals that initial drops frequently extend into the following month. However, the Nasdaq rebounded after six months in nearly every instance, averaging a 9.41% gain from the correction bottom over three months and a 17.03% advance over six months. The primary exception occurred in January 2022, when macro headwinds pushed the index down an additional 24.3% over the subsequent year.
Market analysts note that post-midterm election cycles historically bring elevated volatility before long-term upward trends resume. Examination of 13 midterm cycles since 1974 shows the Nasdaq traded higher 12 months after the vote in all but one instance. Although near-term swings can be sharp—much like the December pullback seen following the 2018 midterms—historical trends suggest that initial post-election volatility often resolves into solid multi-month gains.
Key Takeaways
- The Nasdaq Composite dropped over 5% in a single day, entering technical correction territory at more than 11% below its recent record high.
- Election results and proposed state-level moratoriums on data center construction sparked sharp declines across semiconductor and artificial intelligence stocks.
- Historical data demonstrates that while corrections often bring continued short-term selling, the index averages strong recoveries within three to six months.
Editor’s Analysis & Impact
The recent pullback across tech equities underscores how sensitive high-valuation growth sectors are to sudden political and policy shifts. Concerns over data center development moratoriums strike at the engine of the current artificial intelligence market, which depends heavily on continuous cloud and computing infrastructure scale-outs. While immediate risk-off sentiment has severely impacted semiconductor funds and major technology names, historical precedent shows that market corrections regularly create attractive re-entry opportunities once political sentiment stabilizes. Investors should anticipate continued price fluctuations over the next several weeks as markets absorb policy changes, though the fundamental long-term trajectory for advanced tech infrastructure remains robust.
Frequently Asked Questions
Q: What defines a stock market correction?
A: A market correction is defined by Wall Street as a decline of 10% to 19.9% from a recent record high. A drop of 20% or more is categorized as a bear market.
Q: Why did tech and semiconductor stocks drop so rapidly?
A: The slide was driven by midterm election outcomes, particularly legislative and state-level policy proposals that could restrict data center construction crucial to artificial intelligence development.
Q: How does the Nasdaq usually perform after a correction?
A: While additional selling frequently occurs in the first month following a correction, historical data shows the Nasdaq gains an average of 9.41% after three months and 17.03% after six months.
AI Disclosure: This article is based on verified data and official reports. Our Team and AI have cross-referenced every financial detail with primary sources to ensure total accuracy.
More from this Category