Broad-Based Inflation Squeeze: Why Your Monthly Budget Is Stretching Further Than Ever
American households are navigating a period of intense financial pressure as inflation hits its highest annual rate in nearly three years. While energy costs often dominate the conversation regarding economic instability, the latest data confirms that inflationary trends have broadened significantly, impacting nearly every essential category of the consumer economy, from daily grocery staples to long-term housing commitments.
According to the latest Consumer Price Index, prices rose 0.6% in a single month, pushing the annual inflation rate to 3.8%. Housing remains a primary driver of this strain, with shelter costs climbing 3.3% over the last year. This burden is further compounded by a 7.2% surge in household and tenant insurance premiums, alongside a 4.6% increase in lodging costs, making both homeownership and travel increasingly expensive for the average family.
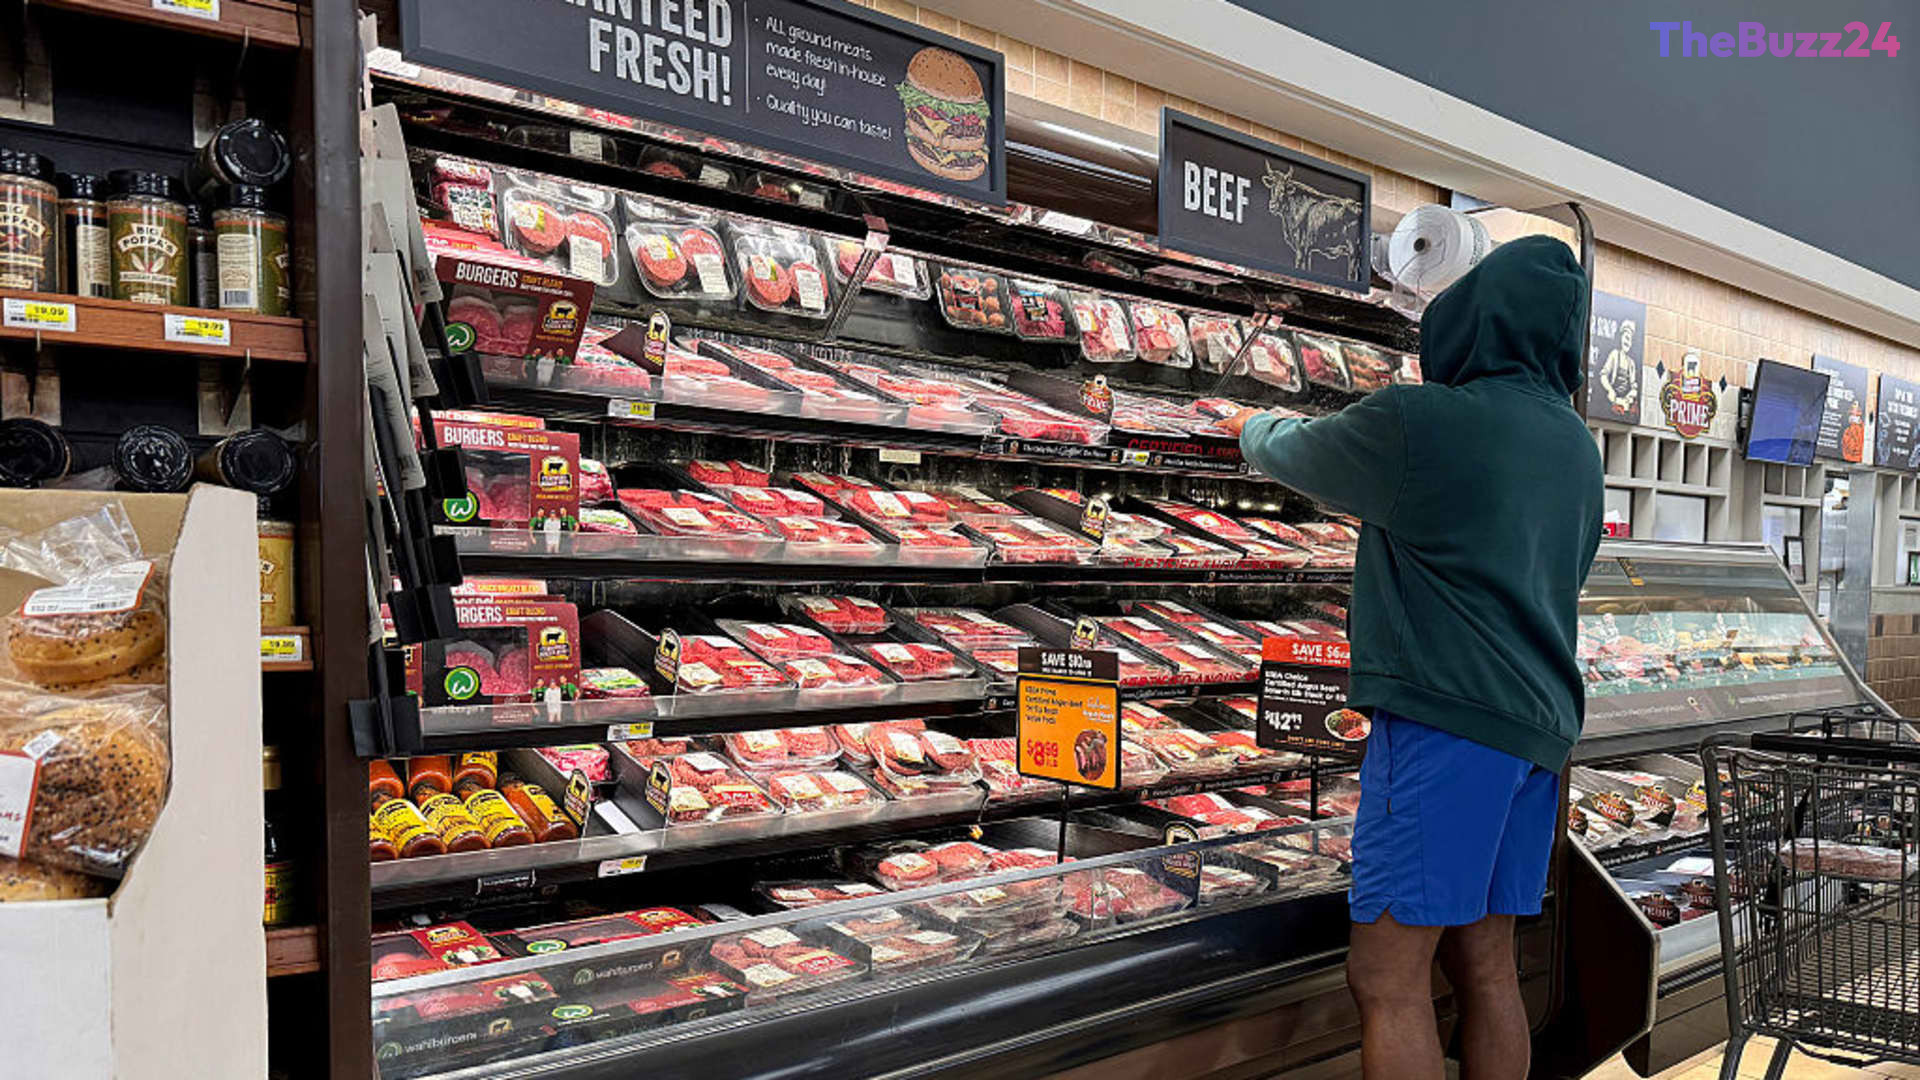
Grocery aisles are reflecting similar volatility, with food-at-home prices jumping 0.7% in April, marking a 2.9% increase year-over-year. Specific commodities have seen extreme price spikes, including a 14.5% rise in ground beef, an 18.5% increase in coffee, and a staggering 39.7% jump in the cost of imported tomatoes. These shifts are forcing households to fundamentally alter their consumption patterns as the cost of basic living continues to outpace wage growth.
Beyond necessities, discretionary spending is also under fire. Categories ranging from home furnishings and jewelry to digital services and video game rentals have seen double-digit price hikes. While consumers have found slight relief in the used vehicle market and certain electronics sectors, these isolated price drops are insufficient to offset the widespread inflationary pressure currently defining the broader economic landscape.
Key Takeaways
- The annual inflation rate has climbed to 3.8%, with a 0.6% monthly increase signaling persistent economic pressure.
- Essential costs, particularly housing, shelter, and insurance, are rising significantly, placing a heavy burden on household budgets.
- Grocery staples like coffee, ground beef, and imported produce have seen double-digit price increases, forcing changes in consumer spending habits.
Editor’s Analysis & Impact
The current inflationary environment represents a structural shift rather than a temporary spike. By permeating essential services like insurance and housing alongside volatile food commodities, inflation is effectively eroding the purchasing power of the middle class. The market impact is twofold: first, it forces a contraction in discretionary spending, which threatens growth in the retail and entertainment sectors. Second, it places immense pressure on central banking policies to balance interest rate hikes without triggering a recession. Looking ahead, the persistence of these price increases suggests that ‘sticky’ inflation will remain a defining feature of the economic landscape for the foreseeable future, likely leading to a long-term recalibration of consumer behavior and corporate pricing strategies.
Frequently Asked Questions
Q: Why are grocery prices rising so sharply?
A: Grocery prices are being driven by a combination of supply chain constraints, increased transportation costs, and rising commodity prices for staples like beef and coffee, which have seen significant year-over-year spikes.
Q: Are there any areas where prices are actually decreasing?
A: Yes, while the overall trend is inflationary, some sectors such as used vehicles and certain electronics have experienced year-over-year price declines, providing minor relief to consumers.
AI Disclosure: This article is based on verified data and official reports. Our Team and AI have cross-referenced every financial detail with primary sources to ensure total accuracy.
More from this Category