Market at a Crossroads: How Technical Levels and Volatility Indices Will Dictate the S&P 500’s Next Big Move
Financial markets find themselves locked in a fierce tug-of-war as the S&P 500 hovers around critical technical thresholds following a turbulent period of high-frequency price swings. Market participants are closely monitoring key support and resistance zones, where aggressive dip-buying clashes with swift profit-taking. This delicate equilibrium is heavily influenced by options positioning and dealer hedging mechanisms, which continue to dictate intraday momentum.
At the center of this technical battleground is the behavior of market makers around specific strike prices. Trading data indicates that significant open interest is concentrated near the 750 level on the SPY ETF, serving as a magnet for near-term price action. However, analysts point out that a breach beneath the 745 threshold could neutralize the stabilizing effect typically provided by dealer hedging. Once this threshold is crossed, the market risks transitioning into a negative gamma regime, which often accelerates downward pressure and invites heightened volatility.
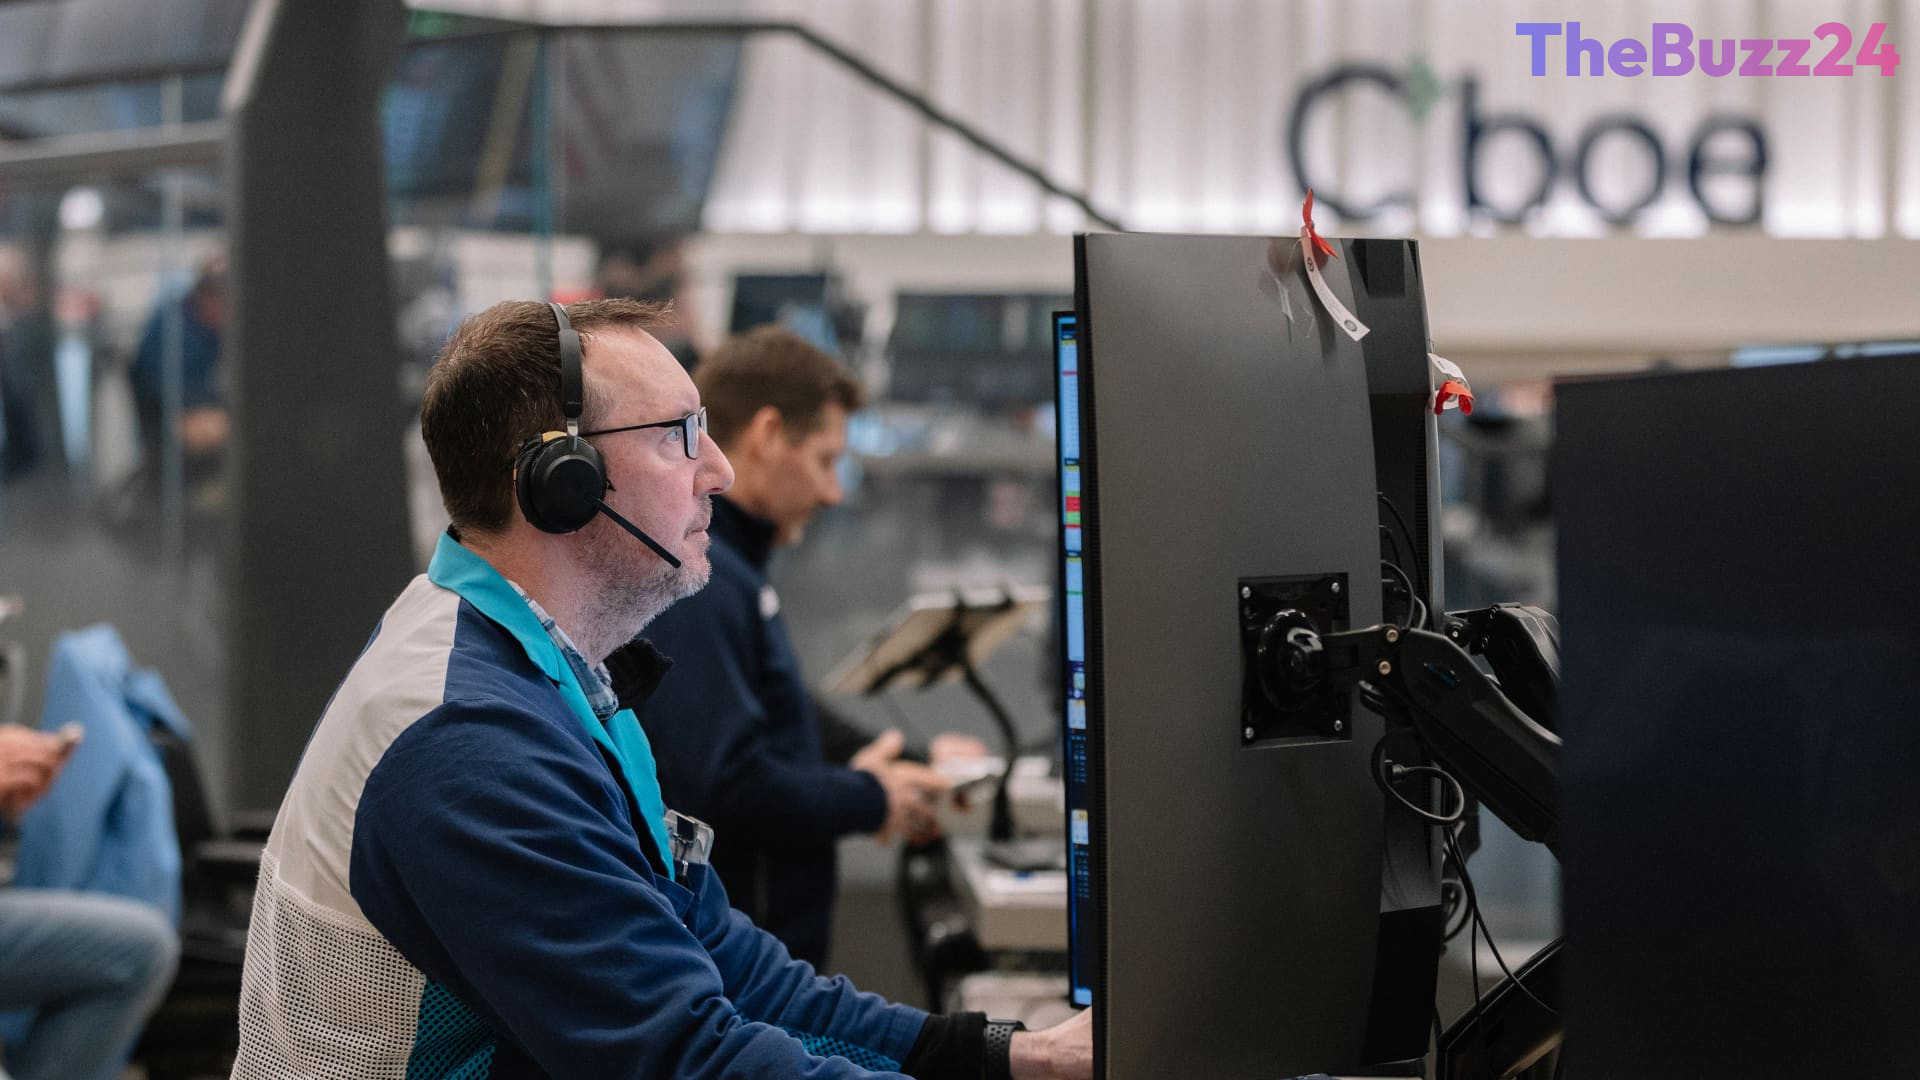
Concurrently, internal market dynamics are showing signs of structural shifts, particularly regarding stock correlations. After plunging to historic lows earlier in the month due to extreme polarization between booming artificial intelligence equities and laggard sectors, Cboe’s 1-month implied correlation index has experienced a notable rebound. Surging from deep lows to double digits, this recovery points toward a broader-based participation across index constituents, contrasting sharply with previous narrow market leadership.
While this rising correlation suggests a healthier and more synchronized underlying market breadth during recent sessions, seasoned observers remain cautious. Past corrections earlier in the year witnessed significantly higher correlation spikes before definitive market bottoms were established. As traders weigh technical fragility against shifting macroeconomic crosscurrents, the upcoming sessions will likely determine whether the benchmark index establishes a durable base or succumbs to a deeper correction.
Key Takeaways
- The S&P 500 is currently testing crucial technical levels, with intense competition between buyers and sellers dictating short-term direction.
- A drop below the 745 threshold on the benchmark could trigger negative gamma dynamics, potentially accelerating downward movement due to reduced dealer stabilization.
- Cboe's 1-month implied correlation index has rebounded from record lows, signaling a shift toward broader market participation among constituents.
Editor’s Analysis & Impact
The current technical standoff in the S&P 500 underscores the delicate balance between structural market mechanics and underlying equity breadth. The transition of dealer hedging into negative gamma territory remains a crucial risk factor for institutional portfolios, as it historically exacerbates intraday drawdowns. Meanwhile, the recovery in implied correlation indices points to a transition away from extreme sector polarization—specifically the heavy reliance on AI-driven tech leaders. However, because historical market bottoms often required significantly higher correlation readings during prior 2024 pullbacks, investors should remain cautious. The broader outlook hinges on whether macroeconomic catalysts will reinforce this newfound breadth or if renewed selling pressure will breach key support zones.
Frequently Asked Questions
Q: What happens if the S&P 500 drops below 7,450?
A: A break below 7,450 could cause market makers to flip into 'negative gamma,' reducing the dip-buying stability that typically supports the index and potentially leading to a sharper downside move.
Q: Why is the Cboe's 1-month implied correlation index important?
A: This index measures the expected correlation between the top 50 stocks in the S&P 500 over the next month. A rising index indicates a more balanced and broader-based market rally, whereas extremely low readings signal high polarization between tech stocks and lagging sectors.
Q: How are options traders influencing current market stability?
A: Options market makers in key financial hubs have been actively buying dips and selling rallies around specific strike zones, creating a temporary seesaw effect that keeps the index constrained within a narrow band.
AI Disclosure: This article is based on verified data and official reports. Our Team and AI have cross-referenced every financial detail with primary sources to ensure total accuracy.
More from this Category