Viewing Earth’s Seasonal Shifts from One Million Miles Away
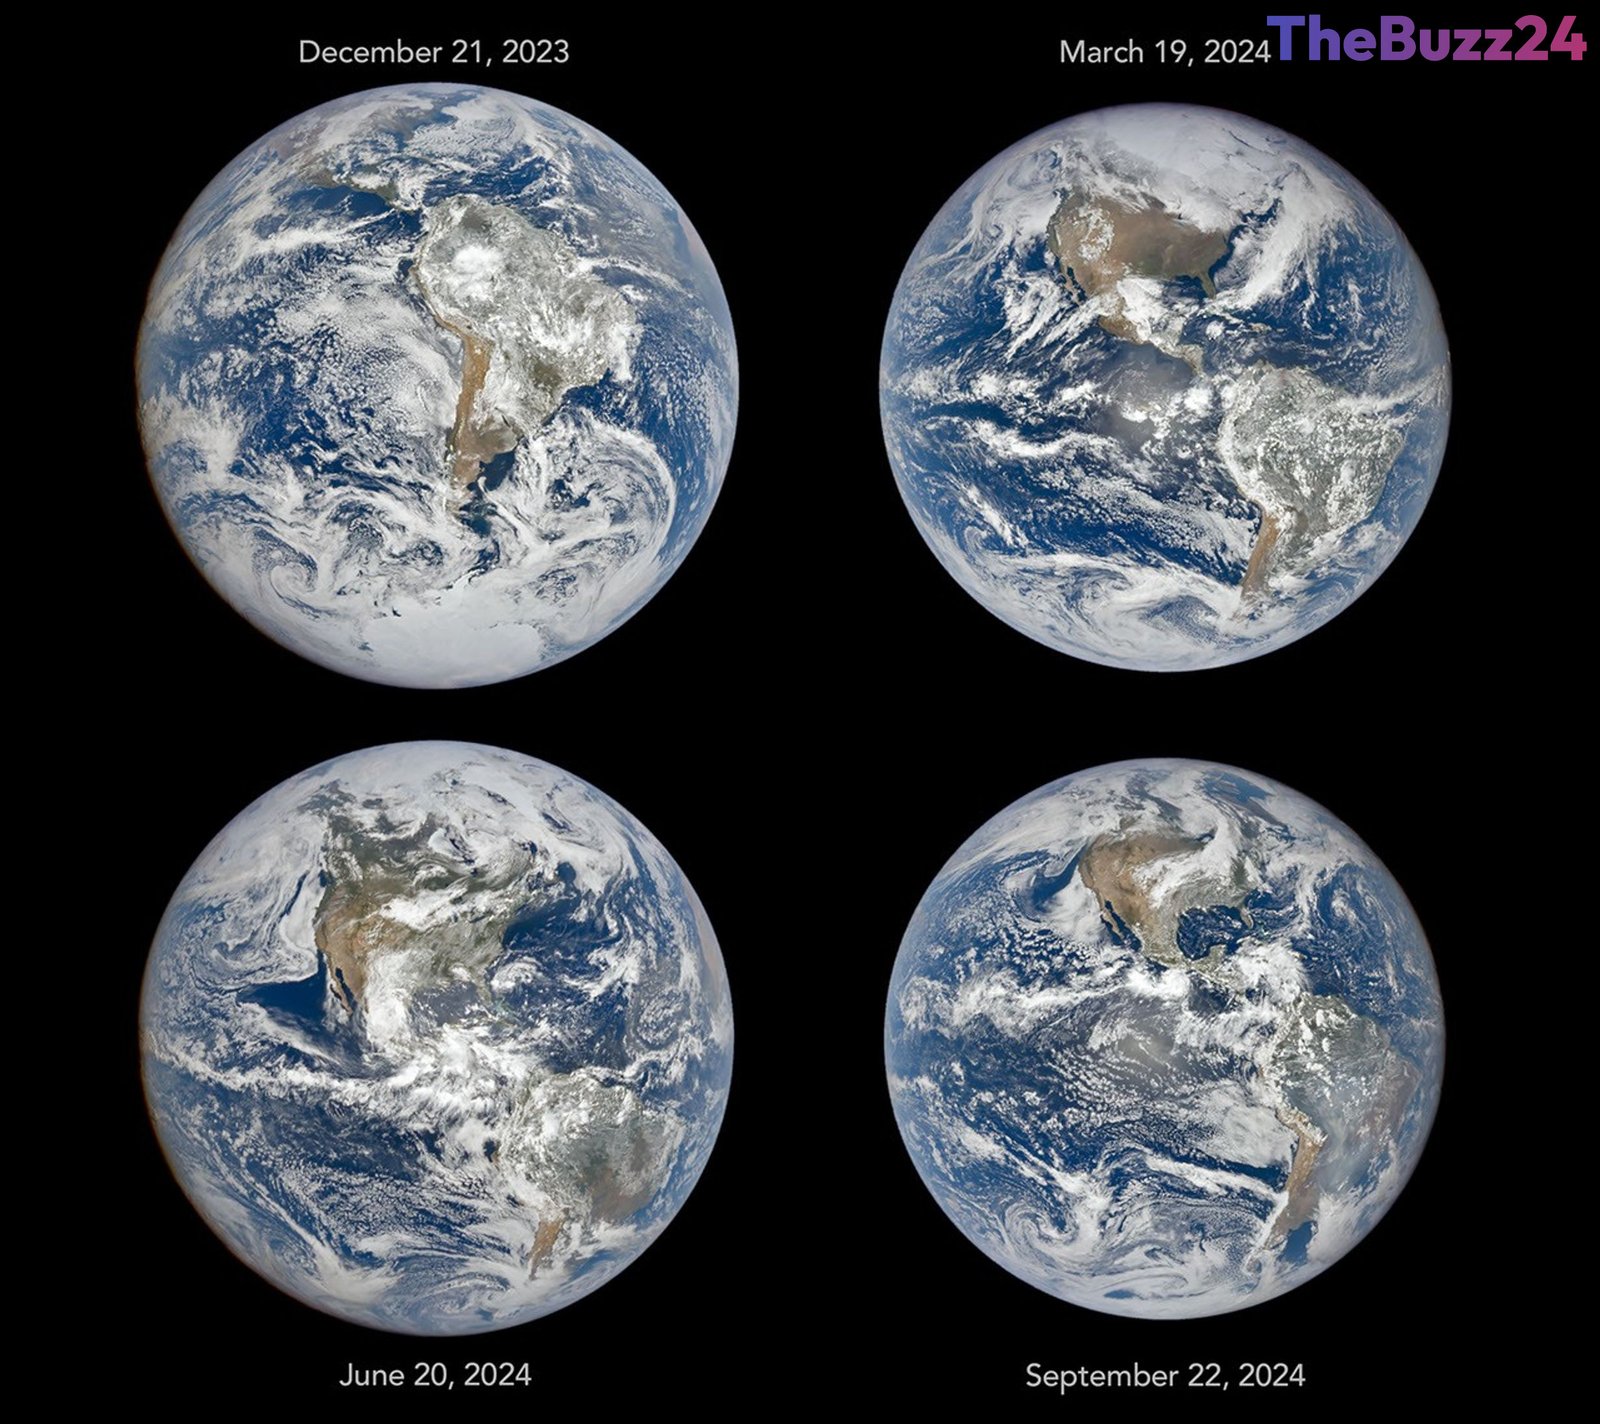
Stunning imagery captured from approximately one million miles away offers a unique perspective on how Earth’s seasonal changes unfold on a planetary scale. Positioned between the Sun and our home planet, specialized deep-space cameras maintain a continuous view of the sunlit hemisphere, documenting the dramatic visual shifts that occur over the course of a year due to the planet’s axial tilt.
Traditional education teaches that seasons are driven by Earth’s roughly 23.5-degree axial tilt during its annual orbit around the Sun. When the Northern Hemisphere leans toward the star in June, it experiences longer, warmer days, while the Southern Hemisphere does the reverse in December. Equinoxes in March and September serve as transitional midpoints where the terminator line divides the poles evenly, yielding nearly equal hours of day and night globally.
Observing these shifts from the Deep Space Climate Observatory reveals distinct geographical changes across solstices and equinoxes. In December images, South America dominates the center of the visible disk alongside Antarctica, while North America slips partially out of view. By June, the vantage point reverses: North America and Arctic sea ice move front and center, pushing Antarctica out of sight. Minor variations in the apparent size and illumination phases of Earth across these images are further influenced by the spacecraft’s specialized Lissajous orbit and changing viewing angles.
Beyond offering an intuitive way to visualize orbital mechanics and seasonal shifts, a decade of continuous deep-space imaging has advanced our understanding of Earth systems. Researchers routinely utilize this unique vantage point to monitor diurnal and seasonal cycles of vegetation, cloud cover, atmospheric aerosols, and ice distribution, proving that deep-space monitoring is an invaluable tool for modern Earth science.
Key Takeaways
- Specialized deep-space cameras capture continuous full-disk images of Earth from a distance of about one million miles.
- Images vividly illustrate how Earth's 23.5-degree axial tilt shifts continental visibility between the December and June solstices.
- Beyond aesthetic appeal, a decade of satellite data helps scientists monitor global vegetation, ice, clouds, and atmospheric phenomena.
Editor’s Analysis & Impact
The capability to observe Earth continuously from the Lagrange point 1 position represents a paradigm shift in how we monitor global environmental and meteorological patterns. While traditional low-Earth-orbit satellites provide high-resolution regional data, deep-space imagery offers a holistic, macro-level perspective akin to viewing a dynamic living organism. This vantage point bridges public science communication and rigorous climatological research, allowing scientists to study diurnal cycles, albedo effects, and aerosol transport on a planetary scale. As Earth observation missions evolve, integrating Lagrange point telemetry will likely become a cornerstone for next-generation climate monitoring, offering vital insights into long-term atmospheric and environmental trends.
Frequently Asked Questions
Q: What causes Earth's seasons?
A: Seasons are caused by Earth rotating on a tilted axis (about 23.5 degrees) as it orbits the Sun, which changes the angle and duration of sunlight received by each hemisphere throughout the year.
Q: Why do Earth images from space sometimes look slightly different in size or shape?
A: Variations in apparent size and illumination are caused by the satellite's specific looping path—known as a Lissajous orbit—around Lagrange point 1, which alters both its distance from Earth and the viewing angle over time.
Q: What is the primary benefit of deep-space Earth observation?
A: It provides a continuous, full-disk view of the sunlit hemisphere, enabling researchers to track large-scale planetary phenomena like cloud patterns, vegetation health, ice dynamics, and atmospheric radiation over time.
AI Disclosure: This article is based on verified data and official reports. Our Team and AI have cross-referenced every financial detail with primary sources to ensure total accuracy.
More from this Category