Mapping the Night: How Satellite Data Unveils Global Economic and Energy Shifts
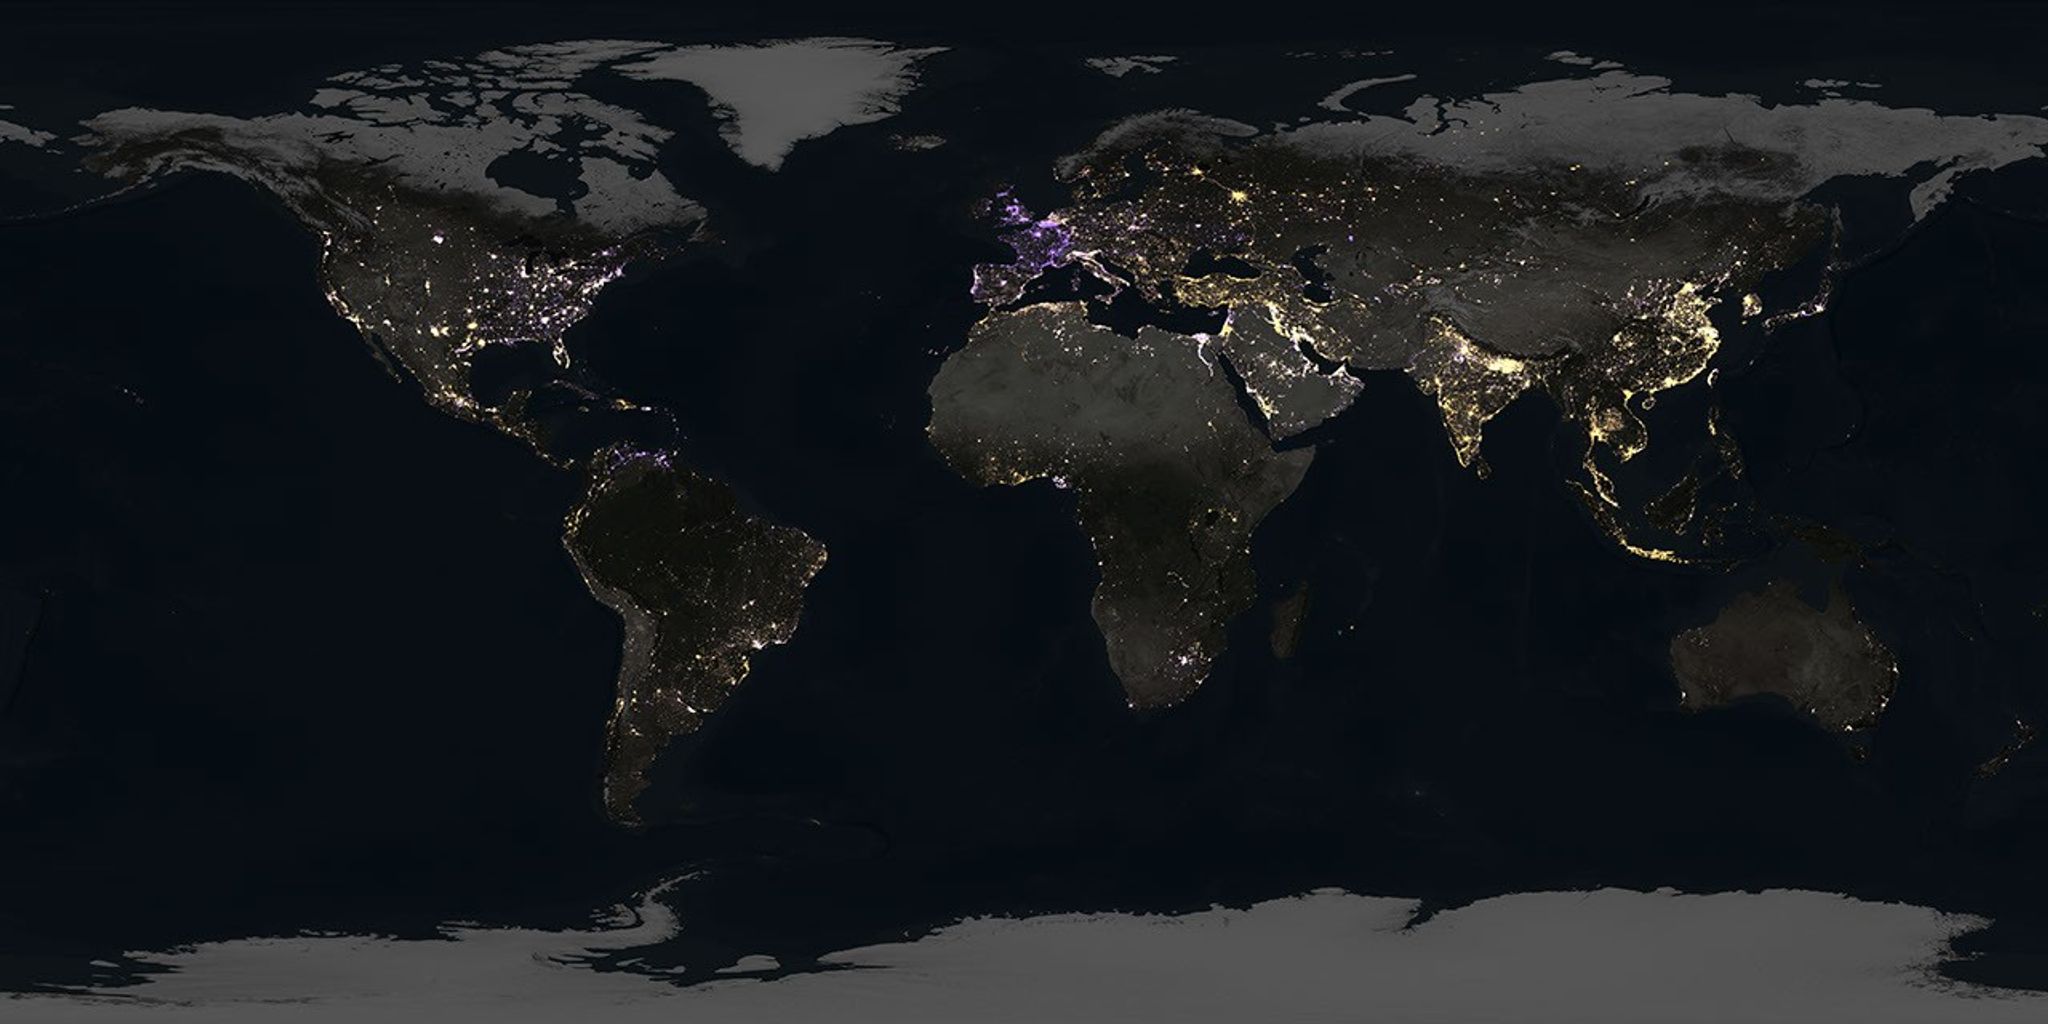
A decade of high-resolution satellite imagery has fundamentally changed how we monitor human activity from space. By analyzing over 1.16 million images captured between 2014 and 2022, researchers have created a comprehensive map that tracks industrial development, energy efficiency, and geopolitical changes. This granular data, capable of pinpointing light sources as small as a single toll booth, reveals that the planet’s nighttime illumination is undergoing a complex transformation rather than a uniform increase in brightness.
Industrial hubs in the United States, specifically the Permian Basin and the Bakken Formation, serve as primary examples of how this technology tracks fossil fuel production. The data captures cycles of gas flaring—the burning of excess methane at oil wellheads—providing a transparent visual record of energy extraction. By making this information accessible, regulators and investors gain a powerful tool to monitor wasted resources and industrial output that were previously difficult to quantify on a global scale.
Regional trends in energy consumption show a stark contrast in how nations manage their footprints. While global radiance has risen by roughly 34%, this aggregate figure hides localized shifts. Many urban centers across the United Kingdom, France, the Netherlands, and the United States have experienced significant dimming, a trend largely driven by the transition to energy-efficient LED lighting and proactive conservation policies. Conversely, rapid urbanization in parts of India and China continues to push nighttime light levels higher.
Utilizing advanced algorithms to filter out atmospheric interference like clouds and moonlight, this satellite monitoring provides a real-time pulse of global economic activity. From the sudden reduction in light during the 2022 European energy crisis to the steady growth of metropolitan areas, these observations have become an indispensable asset for policymakers, environmental scientists, and security analysts alike.
Key Takeaways
- Satellite imagery from 2014 to 2022 reveals a complex, non-uniform shift in global nighttime illumination patterns.
- Gas flaring in major U.S. oil basins can now be tracked via satellite, providing greater transparency for environmental and industrial monitoring.
- While global light levels have increased by 34%, many Western nations are seeing a decrease in radiance due to the adoption of LED technology and energy conservation.
Editor’s Analysis & Impact
The ability to track global economic and industrial activity through nighttime satellite imagery represents a paradigm shift in data-driven decision-making. By moving beyond traditional self-reported economic data, analysts can now verify industrial output and energy consumption in real-time. This technology has profound implications for ESG (Environmental, Social, and Governance) investing, as it allows for the objective verification of corporate and national sustainability claims. Looking forward, as these algorithms become more sophisticated, we can expect this data to play a critical role in international climate negotiations and the enforcement of carbon emission standards. The divergence between the ‘dimming’ West and the ‘brightening’ developing world highlights a clear transition in energy infrastructure, suggesting that future economic growth will be increasingly decoupled from traditional light-heavy energy consumption models.
Frequently Asked Questions
Q: How do researchers filter out clouds and moonlight from satellite images?
A: Researchers utilize advanced, specialized algorithms designed to process large datasets, which can isolate and remove interference from atmospheric conditions like cloud cover and lunar light to ensure the accuracy of the illumination data.
Q: Why is the dimming of cities in the U.S. and Europe considered a positive trend?
A: The dimming is largely attributed to the widespread adoption of energy-efficient LED lighting and deliberate government conservation policies, which reduce energy waste and lower the overall carbon footprint of urban areas.
AI Disclosure: This article is based on verified data and official reports. Our AI have cross-referenced every financial detail with primary sources to ensure total accuracy.
More from this Category