Sui Faces Downward Pressure as Technical Indicators Signal Potential Support Test
The Sui (SUI) token is currently navigating a challenging period, marking its fifth consecutive day of losses with a notable 10% decline in recent trading sessions. This downward trend reflects a broader shift in investor sentiment, as market participants appear to be rotating capital away from certain layer-1 blockchain assets. The sustained selling pressure has raised concerns among traders regarding the token’s ability to maintain its current valuation levels.
Data from the derivatives market further highlights the intensity of the current bearish phase. Open Interest for SUI futures contracts has contracted by over 10% within a 24-hour window, falling to approximately $727.97 million. This reduction is accompanied by significant liquidations, with roughly $7 million in long positions being wiped out. Such activity underscores a market dominated by sellers, as confidence in a short-term rebound continues to wane.
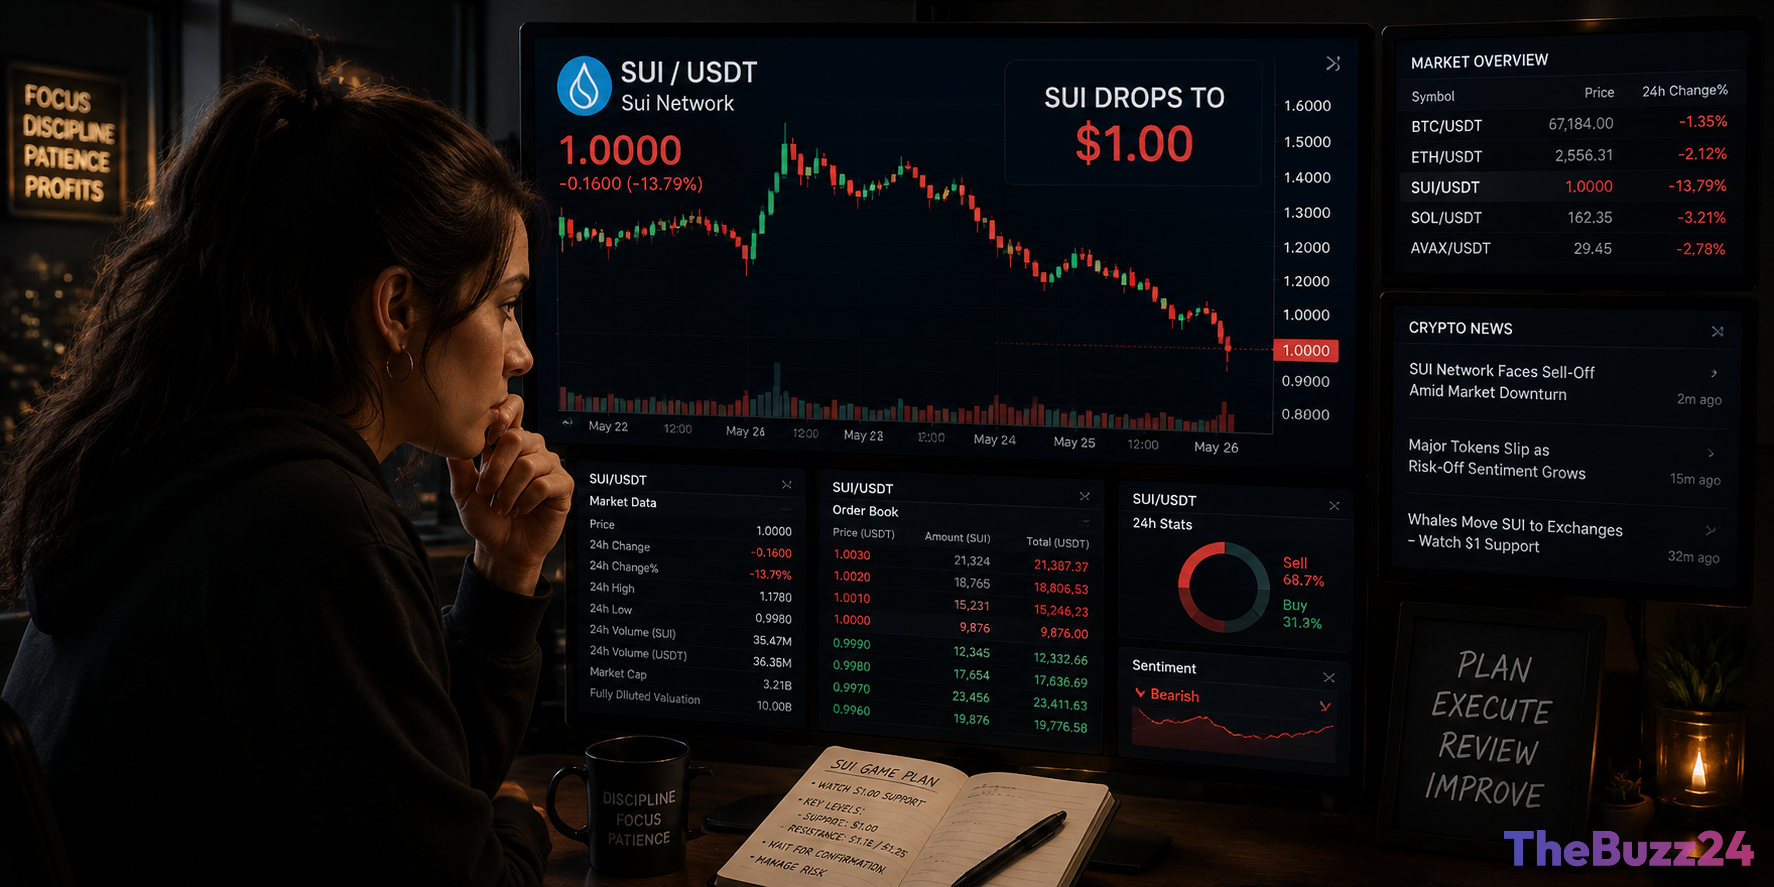
Technical analysis of the SUI/USD four-hour chart reveals a precarious setup. The token is currently trading below its 50-period Exponential Moving Average and has dipped beneath the lower Bollinger Band, signaling strong bearish momentum. While the asset remains above its 200-period EMA, which serves as a long-term support anchor, indicators like the Relative Strength Index and the MACD histogram suggest that any attempts at recovery will likely face stiff resistance. Market participants are now closely monitoring the $1.00 psychological threshold, as a breach of this level could trigger further volatility toward previous cycle lows.
Key Takeaways
- Sui (SUI) has recorded five straight days of losses, dropping approximately 10% as retail interest wanes.
- Derivatives data shows a 10.5% drop in Open Interest and over $7 million in long liquidations, indicating heavy selling pressure.
- Technical indicators, including the RSI and MACD, suggest a bearish outlook with critical support levels identified near the $1.00 mark.
Editor’s Analysis & Impact
The current price action surrounding Sui highlights the volatility inherent in layer-1 blockchain tokens during periods of market consolidation. The significant liquidation of long positions suggests that leveraged traders were caught off-guard by the sudden shift in momentum, which often exacerbates downward moves. From an industry perspective, Sui is currently testing the strength of its community and institutional support. If the token fails to hold the $1.00 support level, it may face a period of prolonged stagnation as it seeks a new floor. Conversely, a successful defense of this level could provide a base for a relief rally, provided that broader market conditions improve. Investors should remain cautious, as the current technical structure favors the bears until a clear reversal pattern emerges on higher timeframes.
Frequently Asked Questions
Q: What is the critical support level for SUI to watch?
A: Market analysts are closely watching the $1.00 psychological threshold. A sustained break below this level could lead to further declines toward the $0.88 range.
Q: Why is the drop in Open Interest significant for SUI?
A: A significant drop in Open Interest, combined with heavy long liquidations, indicates that traders are closing out their positions and exiting the market, which typically confirms a bearish trend and a lack of immediate buying conviction.
AI Disclosure: This article is based on verified data and official reports. Our Team and AI have cross-referenced every financial detail with primary sources to ensure total accuracy.
More from this Category